[Grafana] 서버 구성 (5) - Grafana Loki 구성
Table of Contents
- Ⅰ. OVERVIEW
- Ⅱ. Prometheus 설치
- 1. Prometheus
- 2. Prometheus 설치
- 3. Node Exporter 설치
- 4. Prometheus 및 Node Exporter 연동
- Ⅲ. Grafana 설치
- 1. Grafana
- 2. Grafana 설치
- 3. Grafana 서버 구성
- Ⅳ. Exporter 구성
- 1. DB - MySQL Exporter 구성
- 2. WAS - Tomcat JMX Exporter 구성
- 3. WEB - Apache Exporter 구성
- 4. DB - Oracle DB Exporter 구성
- 5. WAS - WebLogic Monitoring Exporter 구성
- 6. WEB - Apache Exporter 구성 (OHS)
- Ⅴ. Grafana Loki 구성
- 1. Grafana Loki
- 2. Grafana Loki 설치
- 3. Promtail 설치
- 4. Grafana 서버 구성
목차 중, Grafana Plugin 설치에 관한 파트입니다.
Ⅴ. Grafana Loki 구성
1. Grafana Loki
그라파나 로키는 프로메테우스에서 영감을 받았으며, 수평 확장 가능하고 가용성이 높은 멀티테넌트 로그 집계시스템입니다.
또한 매우 비용-효율적이고 운영하기 어렵지 않게 설계되었습니다.
로키는 로그 내용을 인덱싱하지 않고 각 로그 스트림에 대한 레이블 집합을 인덱싱합니다.

동작방식을 좀 더 살펴보자면, 우선 그라파나의 플러그인으로 Enable되어야 합니다.
그리고 프로메테우스가 다양한 종류의 Exporter가 수집한 메트릭을 전달받듯이,
로키 또한 어떠한 형태의 에이전트를 통해 수집한 로그를 전달받아야합니다.
이 역할을 하는 것이 바로 프롬테일(Promtail)입니다.
프롬테일은 모니터링이 필요한 어플리케이션이 위치한 서버에 함께 설치되어야 하며, 당연하게도 로그파일에 접근권한이 있어야 합니다.
관련 문서 참고 ↓
Grafana Loki OSS | Log aggregation system
Grafana Loki Loki is a horizontally scalable, highly available, multi-tenant log aggregation system inspired by Prometheus. It is designed to be very cost effective and easy to operate. It does not index the contents of the logs, but rather a set of labels
grafana.com
https://grafana.com/docs/loki/latest/clients/promtail/
Promtail | Grafana Loki documentation
Promtail Promtail is an agent which ships the contents of local logs to a private Grafana Loki instance or Grafana Cloud. It is usually deployed to every machine that has applications needed to be monitored. It primarily: Discovers targetsAttaches labels t
grafana.com
2. Grafana Loki 설치 (192.168.56.111)
cmd> su - grafana
cmd> cd /monitoring/installcmd> mkdir /monitoring/grafana/loki-2.7.2
cmd> wget https://github.com/grafana/loki/releases/download/v3.4.0/loki-linux-amd64.zip
cmd> unzip loki-linux-amd64.zip -d /monitoring/grafana/loki-2.7.2
cmd> cd /monitoring/grafana/loki-2.7.2
cmd> wget https://github.com/grafana/loki/blob/main/cmd/loki/loki-local-config.yaml
cmd> vi startPromtail.sh
./loki-linux-amd64 -config.file=loki-local-config.yaml &
cmd> vi stopPromtail.sh
ps -ef | grep loki-linux-amd64 | awk {'print "kill -9 " $2'} | sh -x
cmd> chmod 750 *.shloki-local-config.yaml 파일은 그냥 raw 형태로 가장 기본적인 설정만을 가지고 기동을 시켰습니다.
그러나 Enterprise 제품(Grafana Enterprise Logs)으로 제대로 설정을 하기 위해서는 ingester, querier, compactor, ruler, storage 및 admin_client에 대한 부분도 같이 채워넣어줘야 합니다.
그러나 현 문서에서는 Opensource Loki를 다루기도 하고 단순 설치 및 기동이 목표이므로, 그냥 넘어가도 무방합니다.
Reference | Grafana Enterprise Traces documentation
Configuration reference Grafana Enterprise Traces can be configured using a YAML file - specified using the -config.file flag - or CLI flags. In case you combine both, CLI flags take precedence over the YAML config file. The current configuration of any GE
grafana.com
Grafna Enterprise Logs에서 한 부분만 설명을 드리고 넘어가자면
Grafana에는 Admin API라는 개념이 있습니다.
Admin API는 테넌트, 접근 정책, 토큰 등과 같은 리소스를 생성하고 관리가 가능하게 해주는 역할을 합니다.
이 Admin API를 설정하는 부분이 config 파일 상의 admin_client입니다.
admin_client는 서비스를 백엔드 스토리지로 연결하는 설정을 담습니다.
Grafana 플러그인을 사용하는 동안, 대부분 로컬 파일시스템 안에서 경로를 잡아서 설정이 가능하지만
단 하나 별도의 의존성이 있는 부분이 바로 admin_client입니다.
로컬 파일시스템을 옵션으로 지원하지 않으며, 클라우드 서비스의 오브젝트 스토리지를 사용해야만 합니다.
(GCP, AWS, Azure 등)
아래는 그 설정의 예시입니다.
cmd> vi enterprise-logs-local-config.yaml
...
admin_client:
  storage:
    s3:
      endpoint: s3.ap-northeast-2.amazonaws.com
      bucket_name: example-bucket
      access_key_id: <ACCESS_KEY> # TODO: insert your key id
      secret_access_key: <SECRET_ACCESS_KEY> # TODO: insert your secret key
    type: s3
Loki의 실행에는 큰 문제는 없으니, 이 설정 부분은 나중에 자세히 다른 글을 통해 다루겠습니다.
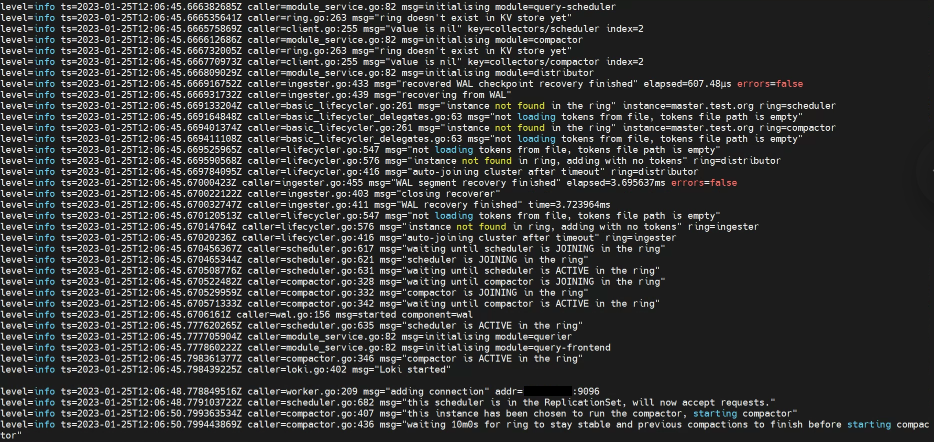
| cmd> ./startLoki.sh |
3. Promtail 설치 (192.168.56.113, 192.168.56.114)
로그 파일이 위치한 두 서버에 설치해야 합니다.
cmd> su - grafana
cmd> cd /monitoring/installcmd> mkdir /monitoring/grafana/promtail-2.7.2
cmd> wget https://github.com/grafana/loki/releases/download/v2.7.2/promtail-linux-amd64.zip
cmd> unzip promtail-linux-amd64.zip -d /monitoring/grafana/promtail-2.7.2
cmd> cd /monitoring/grafana/promtail-2.7.2
cmd> wget https://raw.githubusercontent.com/grafana/loki/main/clients/cmd/promtail/promtail-local-config.yaml
cmd> vi startPromtail.sh
./promtail-linux-amd64 -config.file=promtail-local-config.yaml &
cmd> vi stopPromtail.sh
ps -ef | grep promtail-linux-amd64 | awk {'print "kill -9 " $2'} | sh -x
cmd> chmod 750 *.sh
2-1) Promtail 추가설정 (192.168.56.113)
cmd> vi promtail-local-config.yaml
server:
  http_listen_port: 9080
  grpc_listen_port: 0

positions:
  filename: /monitoring/grafana/promtail-v2.7.2/conf/positions.yaml

clients:
  - url: http://192.168.56.111:3100/loki/api/v1/push
#    basic_auth: # 이 부분은 나중에 Loki 데이터소스 생성할 때, basic_auth를 체크할 경우에
#      username: # 설정한 username과
#      password: # 설정한 password를 넣어주면 됨.

scrape_configs:
- job_name: grafana-apache
  static_configs:
  - targets: ["192.168.56.113:9117"]
    labels:
      job: grafana-apache
      __path__: /app/apache/httpd-2.4.54/logs/*log

- job_name: grafana-tomcat
  static_configs:
  - targets: ['192.168.56.113:8080']
    labels:
      job: grafana-tomcat
      __path__: /app/tomcat/apache-tomcat-9.0.69/logs/*

- job_name: grafana-db-mysql
  static_configs:
  - targets: ['192.168.56.113:9104']
    labels:
      job: grafana-db-mysql
      __path__: /var/log/mysql/mysqld.log
scrape_configs는 하나의 예시에 불과하며, 모니터링하기 원하는 로그 파일의 경로를 잡아주면 됩니다.
(물론 grafana 계정이 해당 로그파일 접근권한을 가지고 있어야 합니다.)
2-2) Promtail 추가설정 (192.168.56.114)
cmd> vi promtail-local-config.yaml
server:
  http_listen_port: 9080
  grpc_listen_port: 0

positions:
  filename: /monitoring/grafana/promtail-v2.7.2/conf/positions.yaml

clients:
  - url: http://192.168.56.111:3100/loki/api/v1/push
#    basic_auth: # 이 부분은 나중에 Loki 데이터소스 생성할 때, basic_auth를 체크할 경우에
#      username: # 설정한 username과
#      password: # 설정한 password를 넣어주면 된다.

scrape_configs:
- job_name: grafana-wls-AdminServer
  static_configs:
  - targets: ['192.168.56.114:9001']
    labels:
      weblogic_domainName: 'base_domanin'
      weblogic_domainUID: 'base_domanin'
      weblogic_serverName: 'AdminServer'
      weblogic_clusterName: 'None'
      job: grafana-wls
      __path__: /app/logs/weblogic/base_domain/AdminServer/stdout/*out

- job_name: grafana-wls-M1
  static_configs:
  - targets: ['192.168.56.114:9002']
    labels:
      weblogic_domainName: 'base_domanin'
      weblogic_domainUID: 'base_domanin'
      weblogic_serverName: 'M1'
      weblogic_clusterName: 'None'
      job: grafana-wls
      __path__: /app/logs/weblogic/base_domain/M1/stdout/*out

- job_name: grafana-ohs
  static_configs:
  - targets: ["192.168.56.114:9117"]
    labels:
      job: grafana-ohs
      __path__: /app/ohs/ohs12c/domains/base_domain/servers/web1/logs/*log

- job_name: grafana-db-oracle
  static_configs:
  - targets: ["192.168.56.114:9161"]
    labels:
      job: grafana-db-oracle
      __path__: /app/db/oracle/admin/orcl/adump/*202211121*

- job_name: grafana-db-alert
  static_configs:
  - targets: ["192.168.56.114:9161"]
    labels:
      job: grafana-db-alert
      __path__: /app/db/oracle/19.3/rdbms/log/*trc
scrape_configs는 하나의 예시에 불과하며, 모니터링하기 원하는 로그 파일의 경로를 잡아주면 됩니다.
(물론 grafana 계정이 해당 로그파일 접근권한을 가지고 있어야 합니다.)
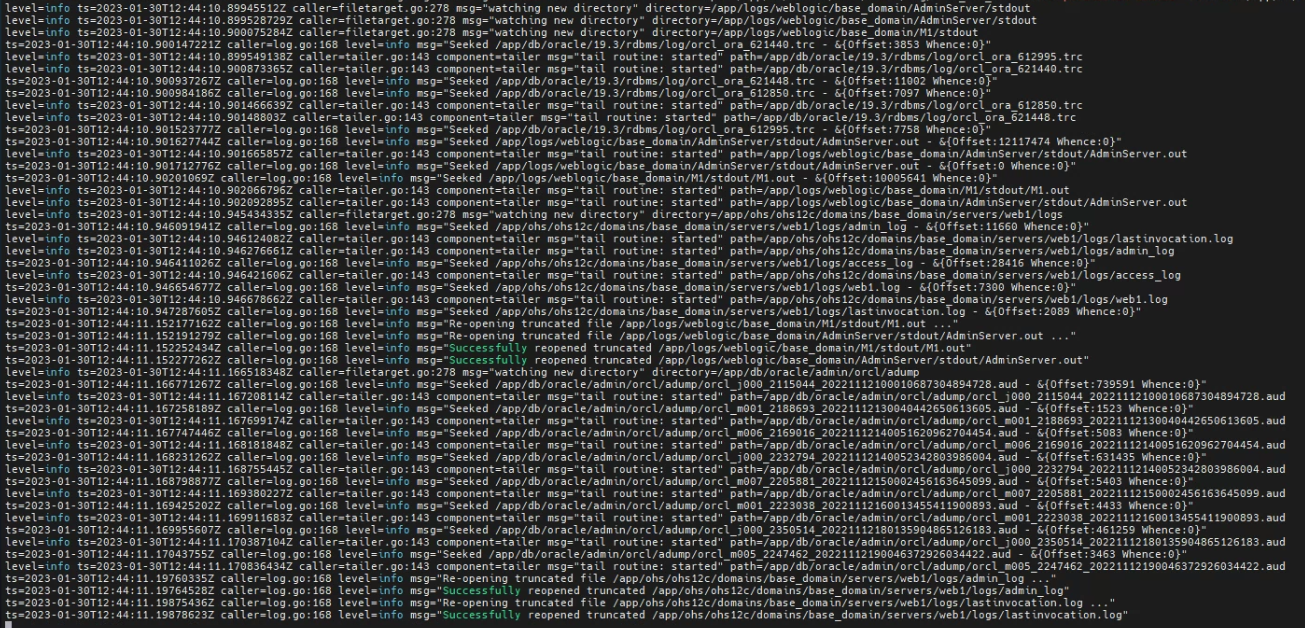
cmd> ./startPromtail.sh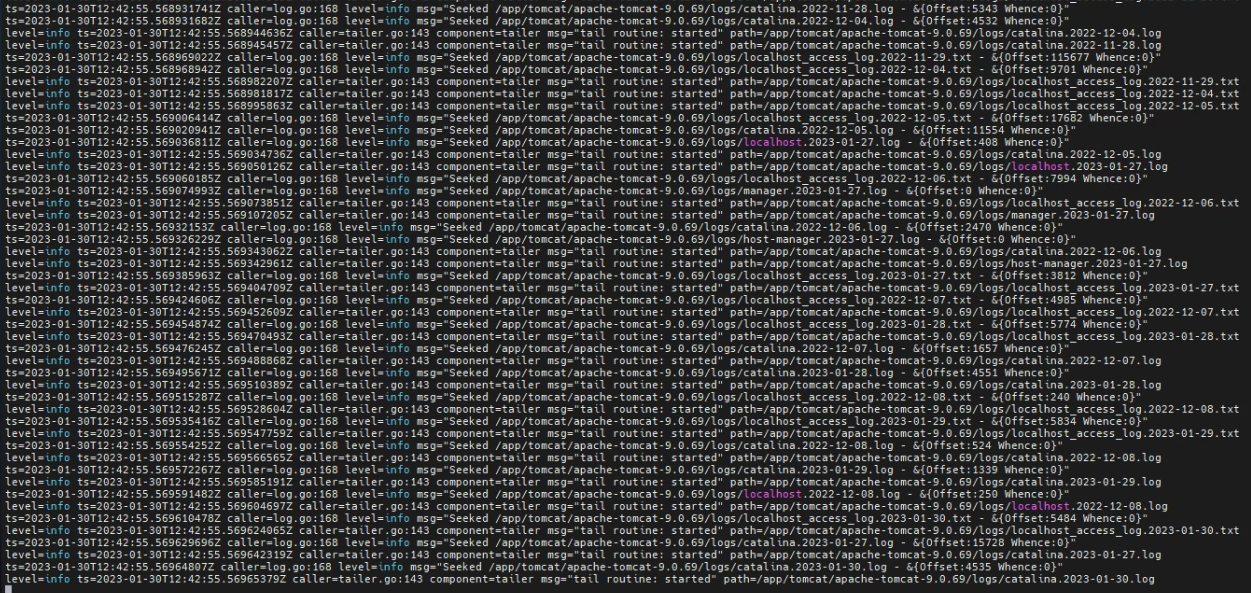
4. Grafana 서버 구성
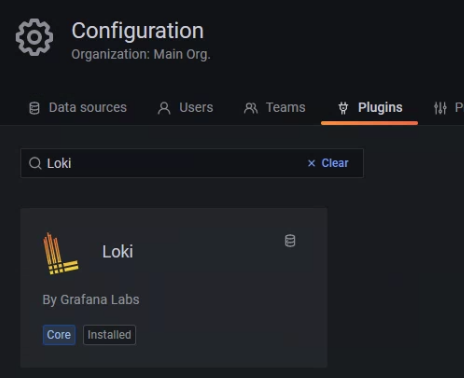
Loki 플러그인을 데이터소스로 추가해줄 것입니다.
데이터소스 생성을 위해 로컬 브라우저를 통해 http://192.168.56.111:3000 에 접속합니다.
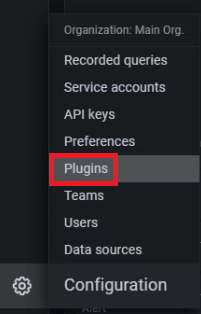
왼쪽 하단의 설정 -> Plugins 클릭
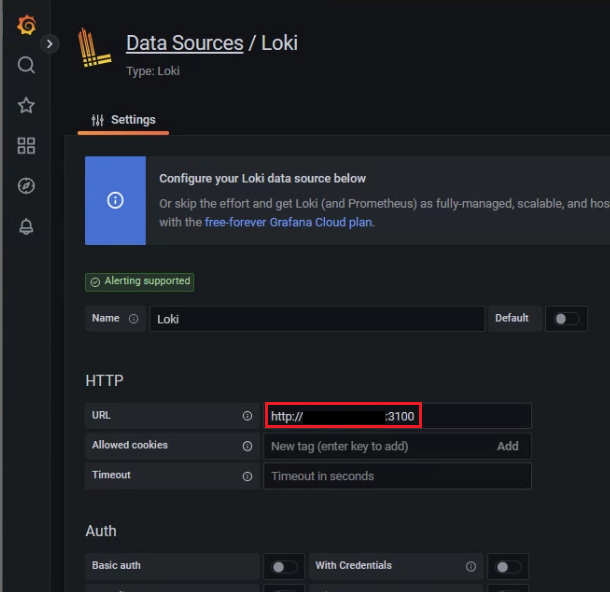
Loki 설치를 해줬던 서버 http://192.168.56.111:3100 로 URL을 입력해줍니다.
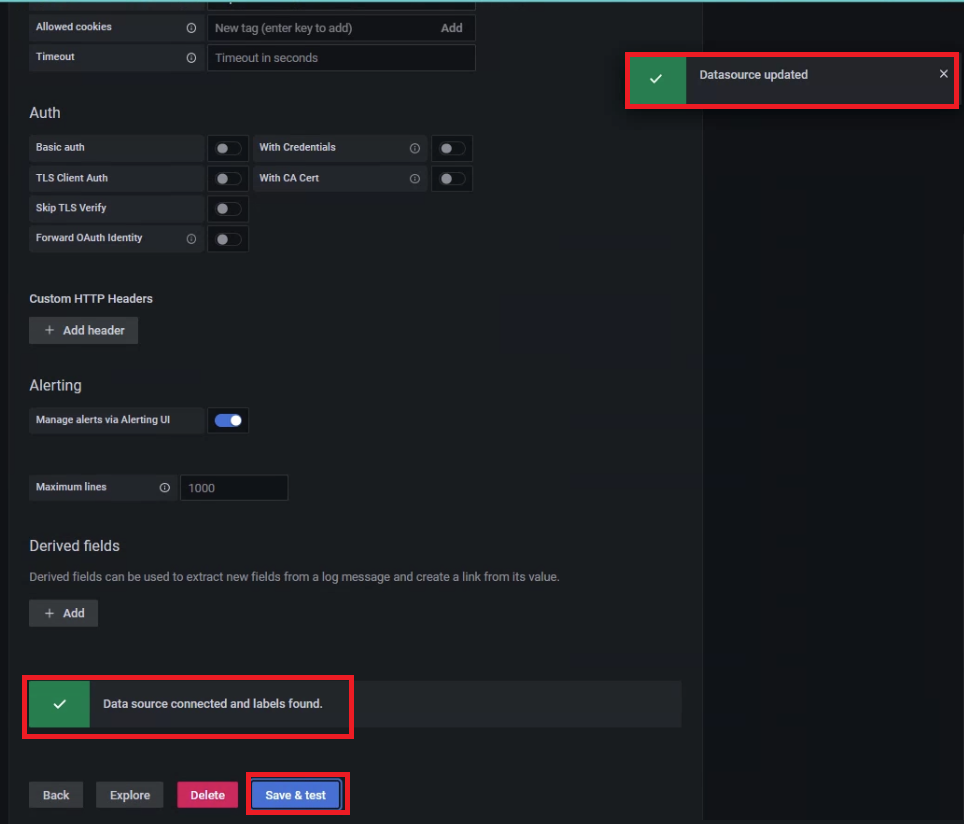
그리고 아래로 내려가 [Save & test]를 클릭했을 때,
우측 상단에 'Datasource updated' 라는 성공 메세지가 뜨는 동시에
하단에 'Data source connected and labels found.'라는 성공 메세지가 떠야
데이터소스가 정상적으로 생성이 된 것입니다.
추가적으로 기본적인 보안 강화로
Auth -> basic_auth 를 체크하고 User 및 Password를 설정해줄 수가 있습니다.
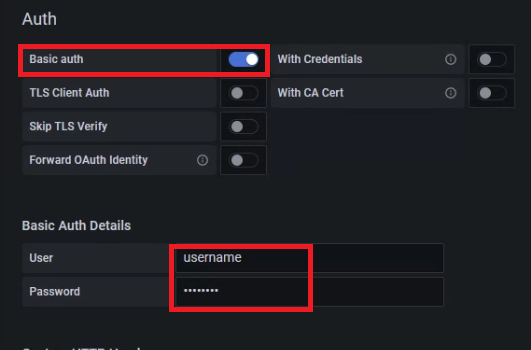
promtail-local-config.yaml 파일에서 아래와 같이 설정해주면 됩니다.
cmd> vi promtail-local-config.yaml
server:
  http_listen_port: 9080
  grpc_listen_port: 0

positions:
  filename: /monitoring/grafana/promtail-v2.7.2/conf/positions.yaml

clients:
  - url: http://192.168.56.111:3100/loki/api/v1/push
    basic_auth:
      username: <USERNAME>
      password: <PASSWORD>
...
새로운 대시보드에서 새로운 패널 추가를 합니다.
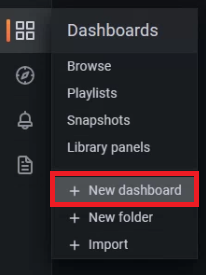
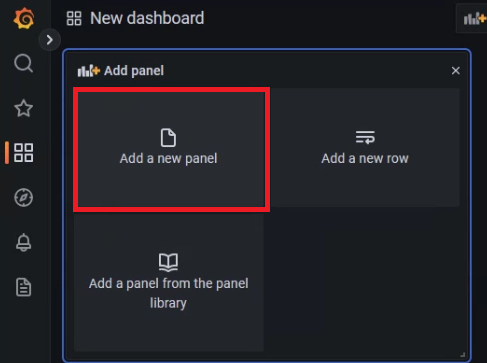
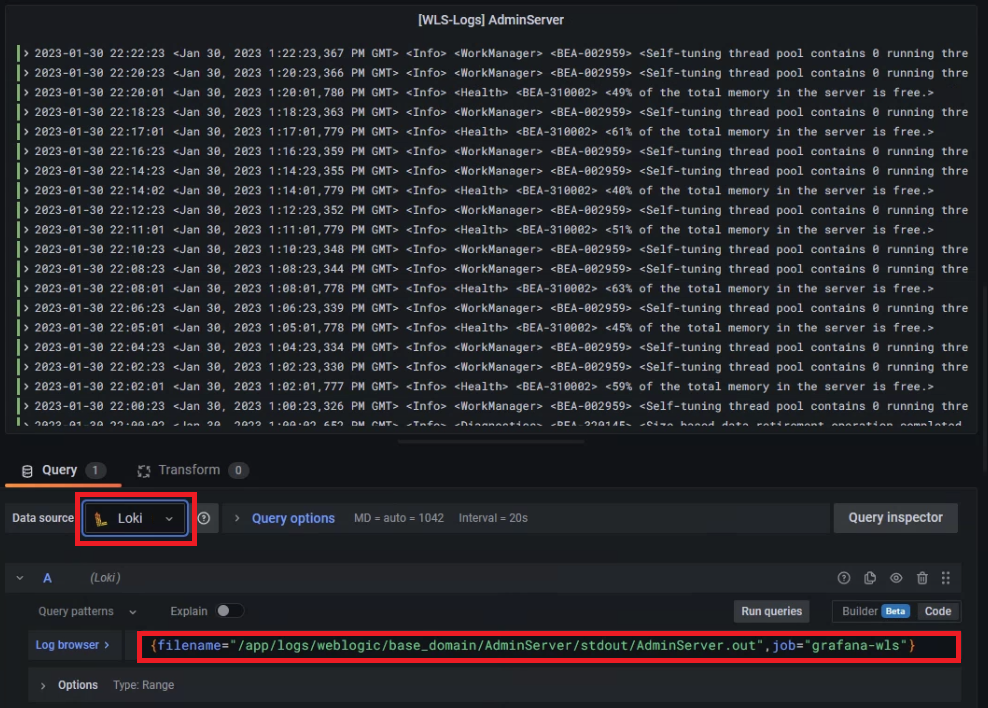
여기서 데이터소스를 Loki로 지정하고
로그 브라우저를 통해 로그파일 경로와 job 등 상세 조건을 잡아주면 됩니다.
{filename="/app/logs/weblogic/base_domain/AdminServer/stdout/AdminServer.out",job="grafana-wls"}
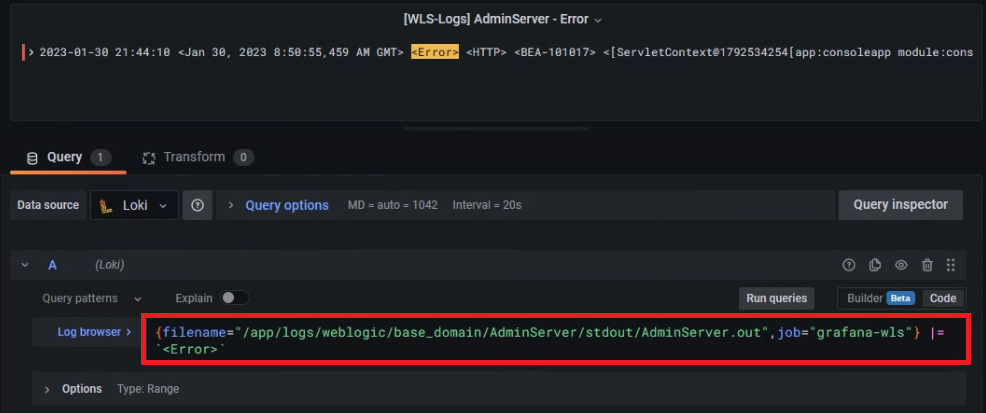
만약 Error 로그만 필터링하여 보고싶다면, 아래와 같이 걸어주면 됩니다.
{filename="/app/logs/weblogic/base_domain/AdminServer/stdout/AdminServer.out",job="grafana-wls"} |= `<Error>`
기존의 메트릭을 확인하던 대시보드에
방금의 방법으로 로그 패널까지 넣어 같이 확인한다면 아래와 같은 형태가 되겠습니다.
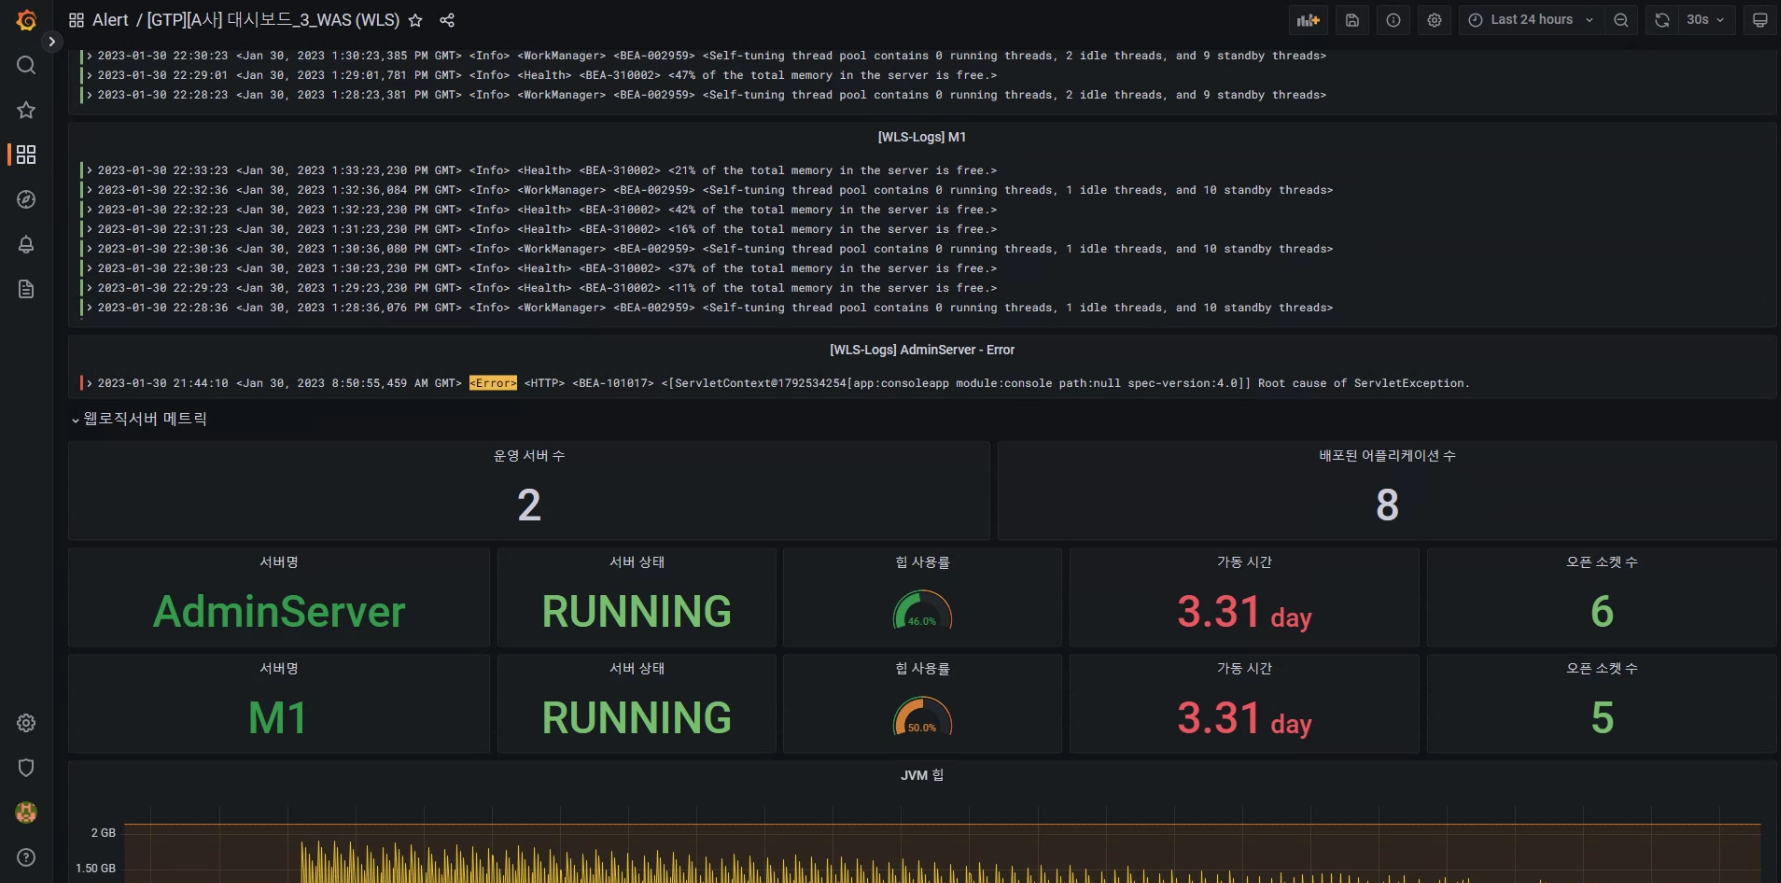
이로서, 오픈소스 Grafana와 Prometheus 및 각종 Exporter와 Plugin을 활용한 테스트가 마무리되었습니다.
이어서 Alert 설정에 대한 부분 (아마 Teams나 Slack을 활용하게 될 겁니다)이나
다른 플러그인(ex - 메트릭은 Mimir 및 트레이스는 Tempo)을 활용한 포스트가 업데이트될 수 있습니다.